Programming in natural language
Jaak Henno, Tallinn University of Technology, Estonia
Hannu Jaakkola, Tampere University, Pori, Finland
Jukka Mäkelä, University of Lapland, Finland
This presentation is on-line at http://staff.ttu.ee/~jaak.henno/conf2025/index_ext_min.htm
Data, the most important modern raw resource, grows rapidly
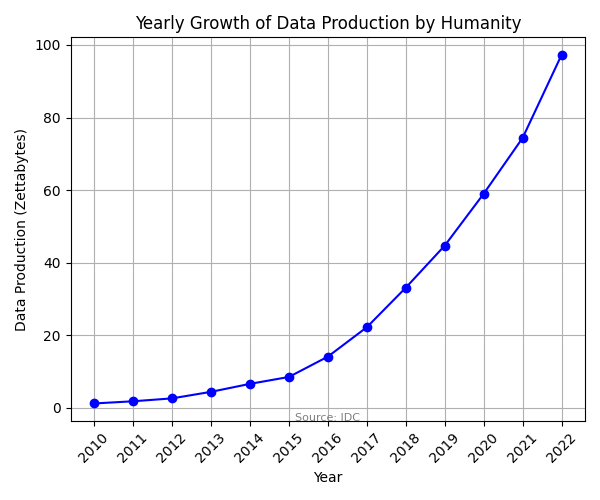
more than 90% of this data remains unused
|
|
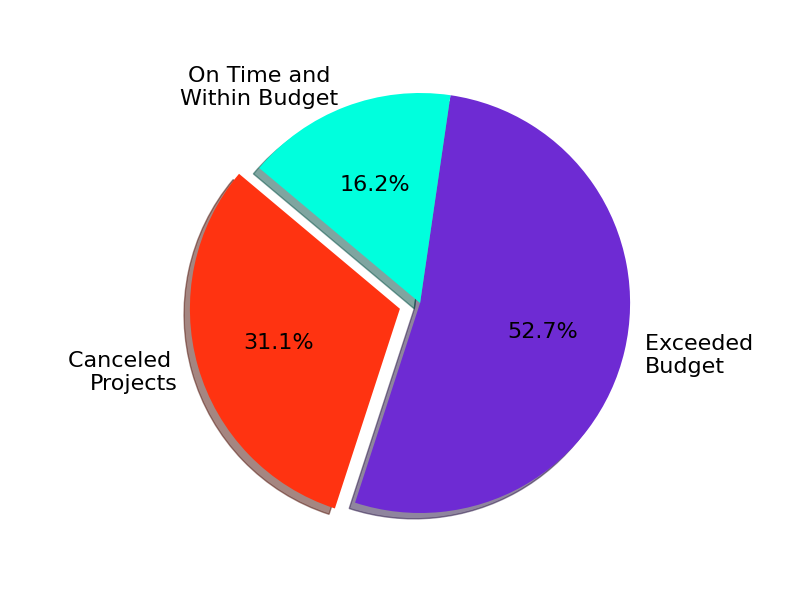
33% of the global software development money is written off annually |
|
|---|---|
COMMUNICATION - Humans and computers do not undersand each other languages |
Programming topics have become very complex 1975: Create a program to calculate sum of integers from 1 to 100...
2025: Create a program to calculate the amino acid sequence coded for by the DNA sequence: 3' T A C C C T A G A 5'
|
|
|
Humans use 30000-35000 words |
Programming languages use less than 100 symbols |

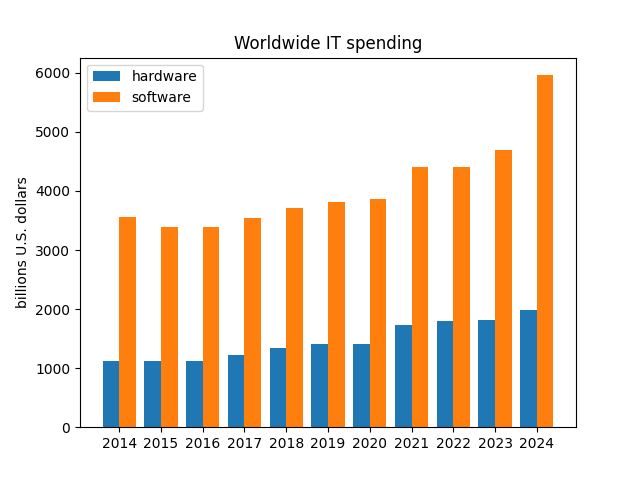
Description of the task (in English) to create a Python program to draw this chart had 34 words
The python program contained 36 lines
The program loads 1175699 lines of code (LOC) from libraries
Nobody knows exactly what these 1175699 lines do
For processing (big) DATA are increasingly used programs based on Large Language Models (LLM) - chatGPT, Gemini, Perplexity
These programs can produce fluent text on several natural languages (English, Estonian, Finnish, Croatian....)
Although these 'fluent chatterers' do not understand a word what they output - they are also able to create (simple) computer programs
1. To LLM was given the task description, e.g. Create a Python program illustrating software project statistics...
|
LLM outputs a Python program, which we execute |
We investigated LLMs abilities with the 'Hello World' example of the Data Science - the iris data set introduced in 1936 by the British statistician and biologist Ronald Fisher
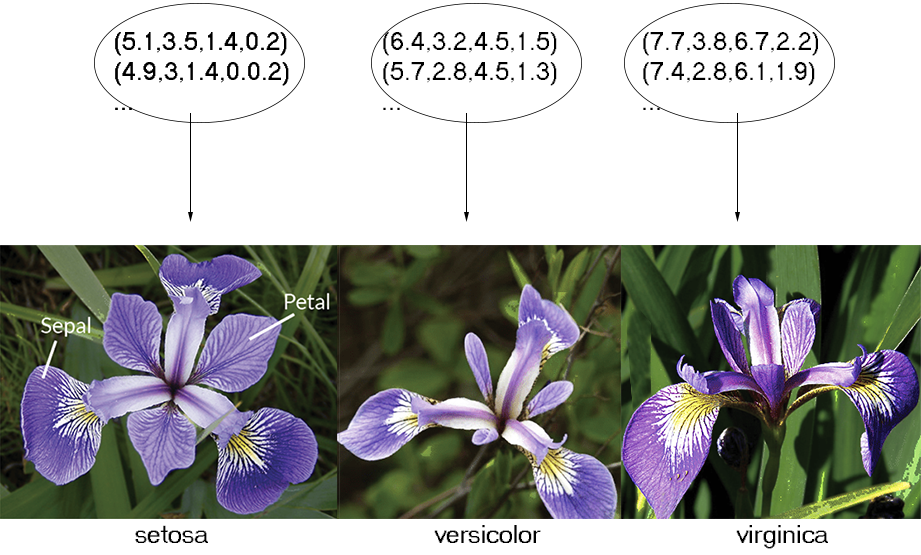
We give similar task to chatGPT, replacing species names with color:
|
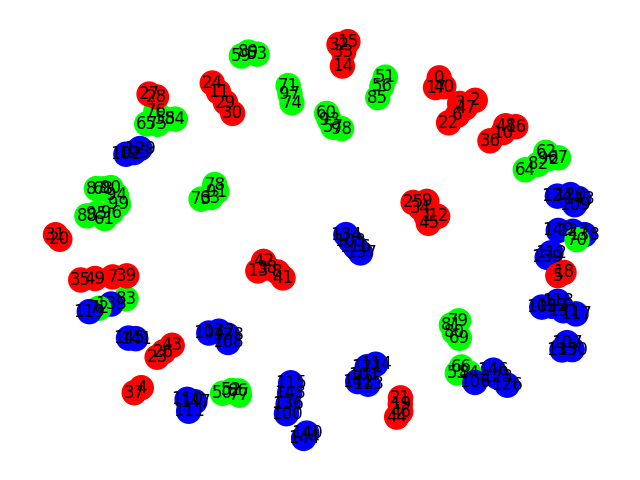
Import list of items from the uploaded file iris_col_dat.py, calculate distances between list items using the first four elements of lists, create graph of items connecting items with minimal distance, color the graph nodes using the last element of the item as an RGB-triple |
|
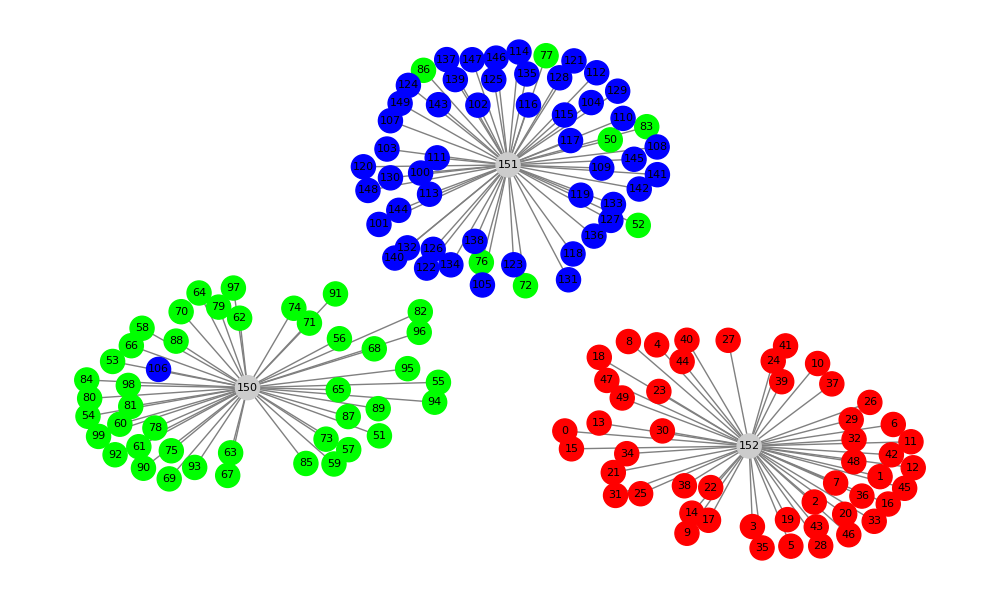
Items from the same Fisher's cluster appered as 42 connected components, but this number is too big to consider it as information compression |
|
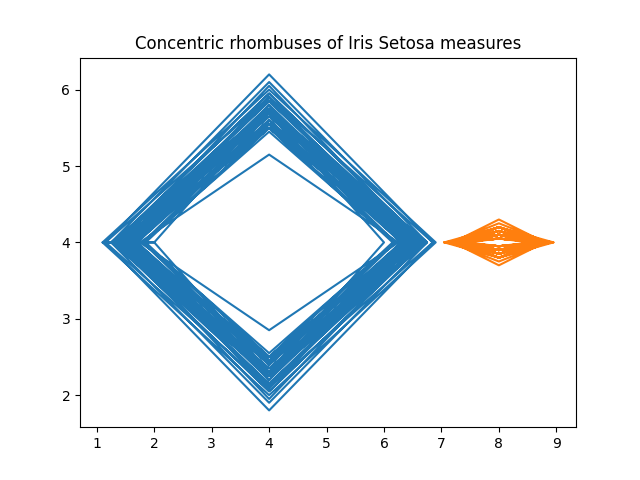
Thus plant data should be considered not as 4-dimensional points, but as 4-dimensional vectors. Vectors similarity appears as minuscule angles between them.
We always study the WORLD in some finite model of some finite fragment of the World, e.g. study iris flowers as a mapping from 4-dimensional data points to names of species
Considering 4-dimensional iris data not as 4-dimensional points, but as 4-dimensional vectors is a change of iris model.
This is something what LLMs can never do
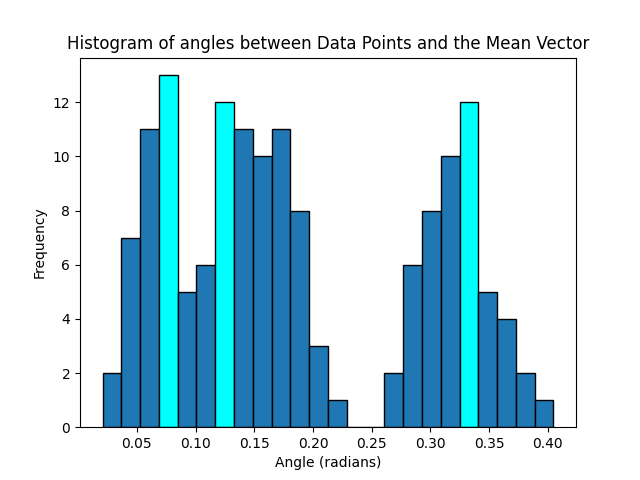
To get overview we asked chatGPT to create histogram of angles between items and a fixed vector - the average of all vectors.
|
"Create a Python 3 program, which imports from the file iris_col_dat.py the list items, finds the mean of the list and creates a histogram with 24 bins of angles of lists of first four components of lists with the mean; set color of 3 locally maximal bins of the histogram to 'aqua'." |
|
Expectation of items in three local maximums were added to the list of items as new 'centers of attraction' |
|
|
Create a Python 3 program, which imports from the file iris_col_dat.py the list of lists Items, using the first 4 items as coordinates finds for each list except the last three distances of the list with the last three lists, finds the minimal distance among these three distances, creates a graph whose nodes are lists from the list Items; for each node except the last thee add edge to node in last three nodes which had minimal distance with the node; color nodes using the last item in the list as the RGB triple for node color |
|
By popular clustering criteria (the Davis-Bouldin-Index, Silhouette score, Calinski-Harabasz Index) this clustering is better than Fisher's |
|